Injected Vaccines, Mucosal Immunity, and Incoherent Estimates of Effectiveness
Contrary to prevailing explanations, biostatistics is not just the technical application of statistics to biomedical data. It is the judicious use of statistics that takes into account background biomedical knowledge. Otherwise, why not call, for example, statistics of demographic data “demostatistics” and statistics of economic data “econostatistics?”
In this post, I connect background knowledge on the mechanism of protection against a respiratory virus with estimates of vaccine effectiveness. I show how that knowledge (biology) can identify incoherent estimates (statistics). In the epilogue, I suggest a scientifically justified (and politically safe) course of action by the FDA.
Mechanisms of Protection
Protection against a respiratory virus can take place at the epithelium of the upper respiratory tract, the initial site of the infection, or in the blood, when the first line of defense has failed. The former is called mucosal immunity, and it takes two forms: innate immunity (“general”) and adaptive immunity (against specific antigens). The latter is primarily attributed to neutralizing secretory IgA antibodies in the fluid that covers the nasal epithelium. We can think about those antibodies as frontline soldiers.
If you read articles on the mRNA vaccines, you find peculiar contradicting perspectives on their mechanism of protection. On the one hand, authors try to claim some mucosal immunity following intramuscular injection, which reads like a desperate search for mechanisms. On the other hand, the same authors emphasize the need for mucosal vaccines (nasal sprays) to prevent infection. So, do injected mRNA vaccines offer mucosal immunity or not?
Probably not. The path from vaccine-induced systemic immune response to immunological reaction in respiratory epithelial cells is tentative and weak at best. For sure it is not the primary mode of protection against Covid (or flu). Keep this paragraph in mind when we compare later estimates of vaccine effectiveness against infection (mucosal immunity) vis-à-vis symptoms if infected (systemic immunity).
Natural immunity, acquired through previous infection, works differently from injected vaccines. The first line of defense — mucosal immunity — is ready to fight off the offender after a previous encounter with the same or a similar offender. Protection against infection, rather than symptoms if infected, is the dominant mechanism. That also seems to make sense, teleologically.
Two Helpful Equations
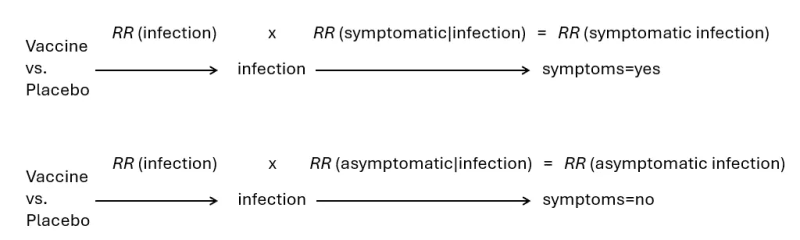
The key endpoint in vaccine effectiveness studies has often been symptomatic infection. What is being estimated, however, is the effect on having symptoms through infection (vaccine → infection → symptoms). And that effect, if measured by a risk ratio (RR), can be decomposed into two components of the causal path: the effect on getting infected (mucosal immunity) times the effect on having symptoms if infected (systemic immunity).
Similarly, the effect on asymptomatic infection can be decomposed into two components: the effect on getting infected times the effect on not having symptoms if infected.
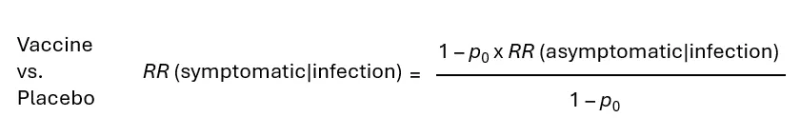
In previous posts, I developed two equations that allow us to compute the risk ratio of having symptoms, if infected, from the “risk” (probability) ratio of remaining asymptomatic. Both equations rely on the proportion of infections in placebo recipients that are asymptomatic. I call this proportion “p” with a subscript 0.
If the vaccine does not prevent infection, namely RR (infection)=1, it can be shown that we get equation 1.
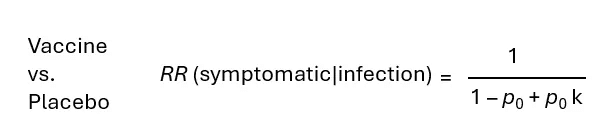
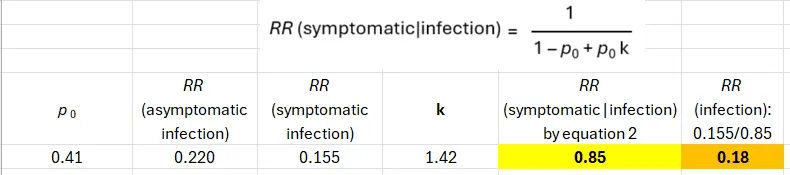
If the vaccine does prevent infection, namely RR (infection) < 1, we get equation 2. In addition to p, we use the ratio RR (asymptomatic infection)/RR (symptomatic infection), which I call “k.”
These simple equations allow us to check the results from vaccine effectiveness studies whenever we have data on the effect on asymptomatic infection. We can decompose the effect on symptomatic infection into its two components — mucosal immunity and systemic immunity — and contrast the estimates with background biological knowledge.
A Study of Natural Immunity (Covid)
I will begin by examining results from a study of the effect of previous Covid infection, not vaccination.
The table below shows data from the paper. In this case, the raw data allow direct computation of all risk ratios of interest. Two key numbers are highlighted. About 40% of the infections in the population without natural protection (no previous infection) were asymptomatic.
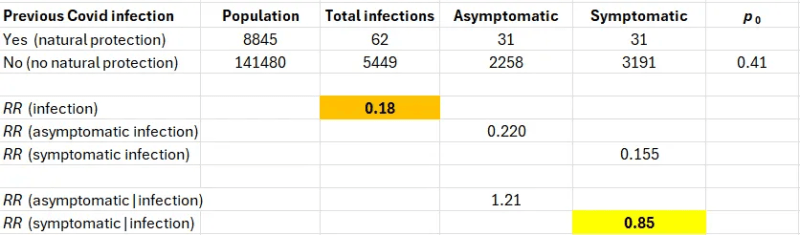
Decomposing RR (symptomatic infection), we find out that the major component is protection against infection (RR=0.18, VE=82%). Protection against symptoms if infected is close to the null (RR=0.85, VE=15%).
The next table shows results based on equation 2; they are identical as expected (i.e., confirming the equation).
These results match our knowledge of natural immunity against respiratory viruses, most of which is mucosal immunity.
The First Dose in the Pfizer Trial (Until the Second)
The data were taken from a previous post on the famous Pfizer trial of the Covid mRNA vaccine. Of note, the frequency of asymptomatic infections in the placebo arm was 40%, identical to the frequency in the population without natural protection (above).
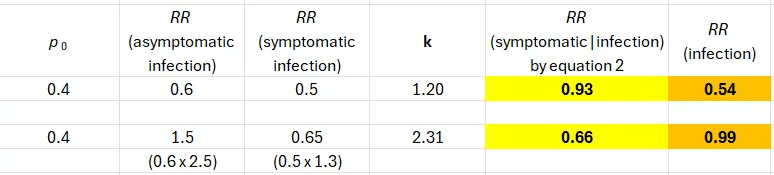
The first row shows incoherent results. Based on background knowledge, it is implausible that an intramuscular injection of a Covid mRNA vaccine would operate exclusively through reduction of the risk of infection (mucosal immunity).
And we know why these results are wrong. The input estimates — 0.6 and 0.5 — are both wrong.
The first one is wrong because the blood test to detect anti-N antibodies misses many more post-vaccination infections than post-placebo infections. The second is wrong because of undercounting symptomatic cases in the vaccine arm. You can find detailed explanations in previous posts as well as justification of the correction factors.
Following correction (above), we observe one result that matches background biological knowledge: no protection against getting infected. The effect on symptoms if infected is 0.66 (VE=34%), and that’s an upper bound because the correction factor (x1.3) is conservative.
So, either the first dose did close to nothing, or it miraculously provided near-perfect protection after 12 days as I demonstrated before. Which was it?
The Second Dose in the Pfizer Trial (Until One Month Later)
In this interval, the frequency of asymptomatic infections in the placebo arm was about 50%. Input risk ratio estimates (0.5 and 0.08) are from Pfizer (approximation).
The first row shows incoherent results again: a strong effect against infection (mucosal immunity), identical in magnitude to the effect on symptoms if infected. Even the most biased minds would not defend this pair of numbers.
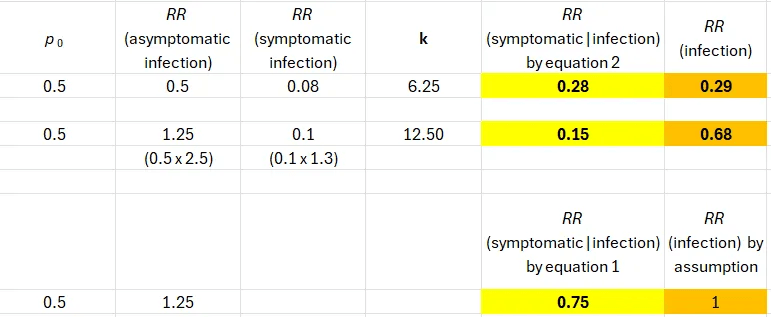
Applying the same correction factors as before, the estimates diverge, but we still observe about 30% effectiveness against infection and 85% against having symptoms if infected. (Using p = 0.4, the corrected values are 44% and 82%, respectively.)
Should we trust the risk ratio of infection after the second dose (0.68) when the estimate after the first dose was null (0.99)? Did a second dose turn on some mucosal immunity that the first dose completely failed to elicit? That’s not how biology works either.
Assuming no effect of an intramuscular injection on getting infected, we get 25% effectiveness (RR=0.75) against symptoms if infected (bottom row). Sensitivity analysis, under that assumption, was presented in a previous post.
A Flu Vaccine
Every year the CDC report estimates of the effectiveness of the flu vaccine that was administered in the past flu season. These estimates are derived from the test-negative design, reflecting the effect on symptomatic infection. In most years, vaccine effectiveness does not exceed 50%, namely, RR(symptomatic infection) > 0.5. The effect on asymptomatic flu infection cannot be estimated from the test-negative design.
A recent paper reported rarely available data from a cohort study: the effect of the flu vaccine in 2022–2023 on both symptomatic infection (VE=38%, RR=0.62) and asymptomatic infection (VE=13%, RR=0.87). The results were based on rate ratios, but I assume that risk (probability) ratios were similar.
The authors reported the frequency of asymptomatic infections in the entire cohort (25%), and we don’t have the value of p. Nonetheless, if the vaccine prevents symptoms when infected, the proportion of asymptomatic infections in the unvaccinated must be smaller than in the entire cohort. Two possible values of p give almost identical results (Table, top part).
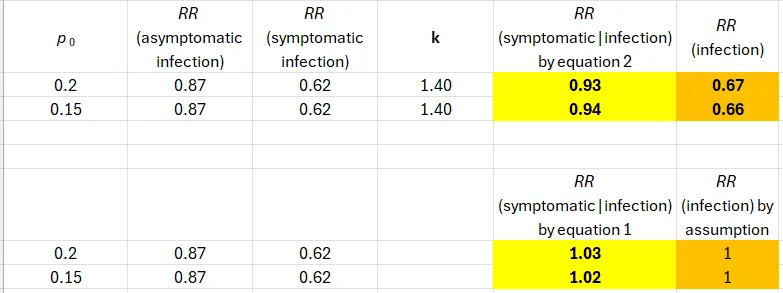
We obtain incoherent estimates. An intramuscular injection reduced the risk of symptomatic flu only by reducing the risk of infection (mucosal immunity). Rejecting that implausible premise, it was a futile vaccine (Table, bottom part).
Epilogue
It is time for the FDA to implement a major revision in the approval of the Covid vaccine and the flu vaccine. It is not enough to show effectiveness against symptomatic infection by the test-negative design or by rising antibody titers. They need to see estimates of the effectiveness against asymptomatic infection to distinguish coherent results from incoherent results. As shown here, the latter have been common.
Republished from Medium
-

Dr. Eyal Shahar is a professor emeritus of public health in epidemiology and biostatistics. His research focuses on epidemiology and methodology. In recent years, Dr. Shahar has also made significant contributions to research methodology, especially in the domain of causal diagrams and biases.

Recent Top Stories
Sorry, we couldn't find any posts. Please try a different search.